ENGLISH SURVEY FINDINGS
USE OF SOCIAL MEDIA AND SMARTPHONES
KEY FINDINGS:
- Around one in five citizens currently do not use a smartphone – almost half of those aged 75 or older do not use a smartphone
- The majority of UK citizens (85%) use some form of social media at least occasionally – 79% use Facebook and 38% use Twitter
- Even though the use of Facebook is greatest among young people , still 39% of those aged 75 or older use it on a daily basis while 55% use it occasionally
- Women are more likely to use Facebook than men – 65% of women use it on a daily basis compared with 52% of men
- A higher proportion of men use Twitter on a daily basis than women – regular Twitter users are also significantly more likely to come from social grades ABC1
Table 1: Proportion of regular smartphone and social media users
| Activity | At least daily | Never | Less than once per week or more |
| Use a smartphone | 73% | 19% | 81% |
| Use Facebook | 59% | 21% | 79% |
| Use Twitter | 18% | 62% | 38% |
| Use other types of social media | 25% | 39% | 61% |
| Post messages on social media | 17% | 34% | 66% |
Smartphone users
Table 1 shows that around three-quarters of the UK population use a smartphone on a daily basis – but 19% currently do not use/own one. This minority – which still amounts to almost 10 million adults in the UK – are therefore quite limited in the extent to which they can use social media to find out or share information. They can do it from their PC – but they cannot do it ‘on the go’. Looking at these 19% more closely, it shows that they are most likely to be older and/or in the lowest social grade of the population.
More specifically, those who do not currently use a smartphone are most likely::
- Be aged 75 or older (49% of this age group do not use a smartphone – compared with 3% of 18-24 year olds) – among those aged 65-74 it is 37% (see Table 2)
- Be in the lowest social grade (E) of which 32% never use a smartphone; in contrast only 10% of those in the highest social grade (A) do not use one
There was no difference depending on gender.
Table 2: Those who never use a smartphone – by age
| Age group | 18-24 | 25-34 | 35-44 | 45-54 | 55-64 | 65-74 | 75+ |
| Never | 3% | 5% | 9% | 19% | 25% | 37% | 49% |
| No. | 3 | 26 | 29 | 68 | 72 | 131 | 47 |
| Total N= | 90 | 484 | 324 | 365 | 285 | 355 | 96 |
Facebook users
Overall, 85% of citizens use some form of social media at least occasionally. As regards Facebook – 79% of UK citizens use Facebook; this includes 59% who use it on a daily basis or more and 20% who use it less often than that (see Figure 1). Again around one in five adult UK citizens (21%), so around 10million people, do not use Facebook at all. Even though there is clearly some overlap with those who never use a smartphone these are the not the same people – thus around, half of those who do not use a Smartphone still use Facebook (as this is often accessed from a PC). In total, around nine per cent of citizens overall neither use a Smartphone nor Facebook – or around 5 million people of the adult UK population (see Table 3 below).
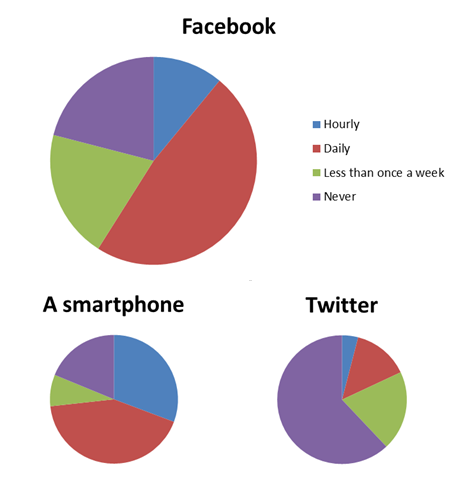
Figure 1: Regularity of Facebook, Twitter and smartphone use among UK citizens
In fact, a slightly smaller sub-sample of these nine per cent – 149 citizens (seven per cent) – indicated that they never use a smartphone and never use any type of social media, including Facebook, Twitter, or other types of social media (including YouTube, Instagram, etc.). Once again these citizens are most likely to be aged 50 or older (79%) and be classified as social grades C2, D or E (62%).
Table 3: Citizens grouped depending on Facebook and/or Smartphone use
| FACEBOOK AND SMARTPHONE USER
68% |
SMARTPHONE USER ONLY
13% |
| FACEBOOK USER ONLY
10% |
DOES NOT USE FACEBOOK OR SMARTPHONE
9% |
Interestingly, even though young people are far more likely to be Facebook users, relatively high proportions of older people use it too. Thus, while 93% of 18-24 year olds use it at least sometimes and 76% of those in this age category use it on a daily basis, 55% of those aged 75 or above use it occasionally or more and 39% on a daily basis. One other noticeable pattern is that there is virtually no difference between 18-24 and 25-34 year olds in the proportion that use Facebook on a daily basis. Further details are provided in Figure 2 below.
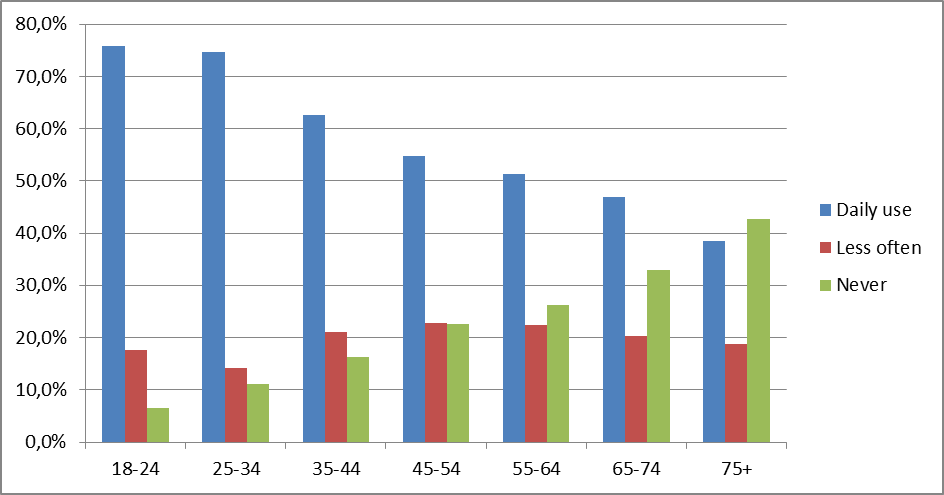
Figure 2: Use of Facebook depending on age
The analysis also showed that there is a significant difference in the use of Facebook depending on gender (Figure 3). Thus, 65% of women use Facebook on a daily basis compared with 53% of men (p<0.001). Similarly, while 82% of women use Facebook at least sometimes, it’s only just above three-quarters of men who do so (p<0.01).
Adult citizens in social grades ABC1 were also slightly more likely to use Facebook (81%) compared with those in lower social grades C2DE (77%) – but this could reflect the fact that 31% of those in social grades C2DE are retired compared with 21% of those in ABC1 – and so this is likely to reflect the older age of those in the lower social grades above anything else.
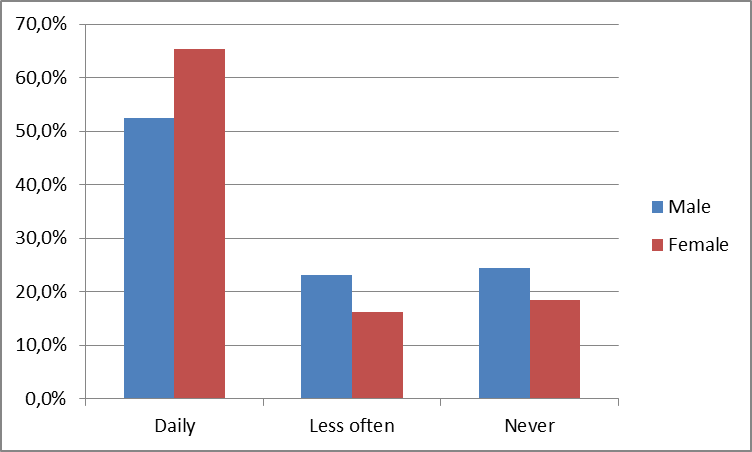
Figure 3: Use of Facebook depending on gender
Twitter users
When it comes to Twitter use – as seen in Table 1 – it is used by fewer people than Facebook. Thus, around one-in-five (18%) use it on a daily basis and 38% use it at least occasionally (less than once a week or more). And once again Twitter users are most likely to be young citizens – 53% of under 50s use Twitter at least sometimes compared with only 22% of those aged 50 or above. This is further illustrated in Figure 4 – which shows that daily Twitter use is at a peak among 18-24 year olds (37%) and falls to just one per cent among those aged 75+.
Looking at those who use Twitter on an hourly basis – the proportion is only relatively high (11%) among both 18-24 and 25-34 year olds. For all other age groups it is at three per cent (35-44 year olds) or below.
Another significant difference is that Twitter users are most likely to come from social grades ABC1 – two-thirds (67%) of those who use Twitter daily are in these social grades. Another way of putting it, is that almost twice as many citizens in social grades ABC1 (23%) use Twitter on a daily basis compared with those in social grades C2DE (13%).
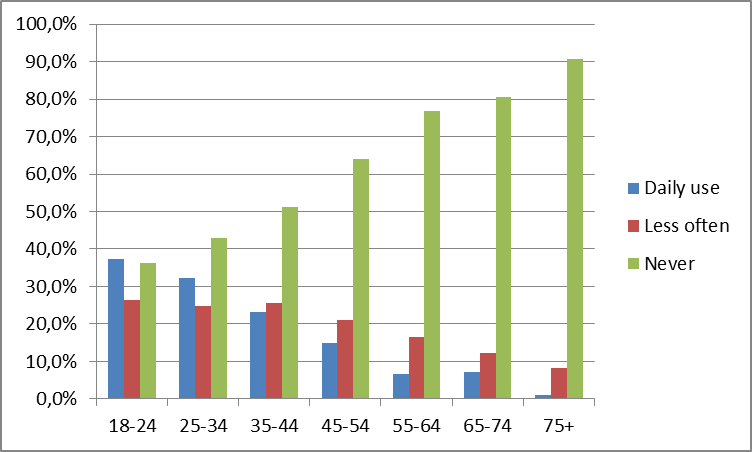 Figure 4: Use of Twitter by age
There is no significant difference among men and women’s use of Twitter overall (i.e. at least occasionally), but men are significantly more likely to use it on a daily basis (22% – this includes 6% who use it on an hourly basis) than women do (15% – only 2% use it on an hourly basis). In numbers, this means that around 5.5million male adults use Twitter on a daily basis and 1.5million on an hourly basis. This contrasts with around 3.75million female adults that use it on a daily basis and 0.5million on an hourly basis.
USE OF SOCIAL MEDIA IN EMERGENCIES
KEY FINDINGS
- Around a third of adult citizens have used social media during an emergency to look for or share information
- Use of social media during emergencies is significantly lower among those aged 45 or older
- The proportion of those aged 18-24 who have used social media in an emergency (56%) is very similar to the proportion of those aged 25-34 (54%)
- Younger people (aged 18-24) are more likely to use social media to look for information during an emergency, while those aged 25-34 are the age group most likely to share information on social media
- Women are significantly more likely to use social media in an emergency than men – particularly to share information with others
- The main reasons for not using social media in an emergency include technological concerns – for example that mobile phones would not work properly in an emergency – and reliability issues (that information on social media is not reliable)
- Less than half of citizens state that data privacy issues are a reason for not using social media in an emergency
- People are most likely to use social media to share weather conditions or warnings road or traffic conditions and their own feelings or emotions about the emergency
- The majority of UK citizens currently do not expect emergency services to respond to messages posted by them on social media – however, the expectation is much greater among younger citizens.
Overall, around a third of adults (34%) have used some form of social media in the past to look for or share information during an emergency, such as an accident, power cut, severe weather, flood or earthquake. As shown in Figure 5, this includes around one-in-five (21%) who used it to share information (six per cent who used it to share information only and 15% who used it to share and look for information) and 13% who used social media just to look for information. It is worth noting that those that have not used it may not have had the need to do so as they may not have experienced an emergency.
Figure 5: Use of social media during an emergency
The age profile of those of who have used social media during an emergency tells an interesting story. As can be seen in Figure 6, around half of citizens in each of the three age categories of those aged below 45 (i.e. 18-24, 25-34 and 35-44) have used social media in this way – with the use the highest among the youngest age group. For the older age categories this use is much smaller – for those aged 45-54 it is only around a quarter (26%) and it declines all the way to nine per cent of citizens aged 75 or older who used social media to look for or share information during an emergency.
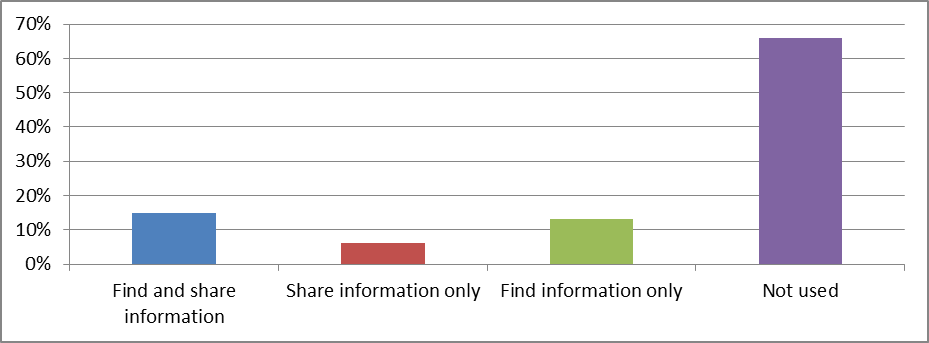
Figure 6: Use of social media in an emergency by age
However, even though the proportion of citizens using social media in an emergency is fairly similar for those aged between 18 and 44, the way it is used is very different. Thus, those in the youngest age group (18-24) are by far the most likely to have used it to look for information only (40%) compared with those in the older age groups – 19% of those aged 25-34 used it to look for information only. In contrast, while 36% of citizens in the 25-34 age group have used social media to share information during an emergency, only 16% of those in the youngest age group have done so. This information is summarised in Table 4 below.
Table 4: Ways of using social media in emergencies by age group
| Age group | Use SM to look for info only | Use SM to share info | Total use |
| 18-24 | 40% | 16% | 56% |
| 25-34 | 19% | 36% | 54% |
| 35-44 | 17% | 29% | 47% |
Similarly, women are significantly more likely to have used social media in an emergency (37%) than men (31%) – while a similar proportion have used it to look for information only (14% of women and 13% of men), the contrast is most noticeable among those who have used it to share information (23% of women and 18% of men).
There is also a significant difference in users depending on their social grade – 38% of those in social grades ABC1 have used social media in an emergency compared with 29% of those in social grades C2DE. The difference is once again most marked when comparing the proportion of users by social grade who shared information during an emergency – 24% of those in social grades ABC1 did so compared with 17% of those in social grades C2DE.
This suggests therefore that women, those aged 25-34 and those in social grades ABC1 are most likely to share information during an emergency.
So what are the reasons why some people are reluctant to use social media during an emergency? Figure 7 below suggests that these relate mainly to technological concerns – that mobile phones and social media would not work properly in a serious emergency (62%) – and reliability worries – that information shared on social media is not reliable (60%) and that there are many false rumours on social media (64%). Lack of confidence in using social media was only a reason for around a third (28%) of citizens.
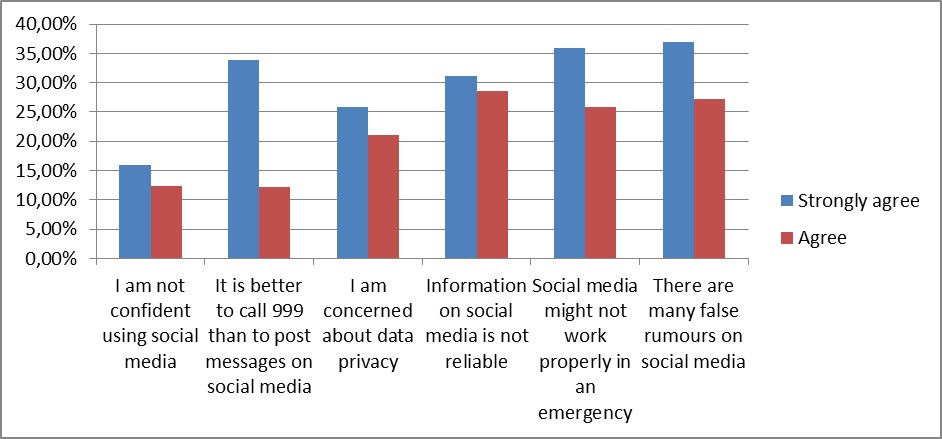
Figure 7: Reasons for not using social media during an emergency
Figure 8 below shows that the 432 citizens who had previously used social media to share information during an emergency were most likely to have done so to share weather conditions or warnings (43%), road or traffic conditions (42%), or their own feelings or emotions about the event (31%).
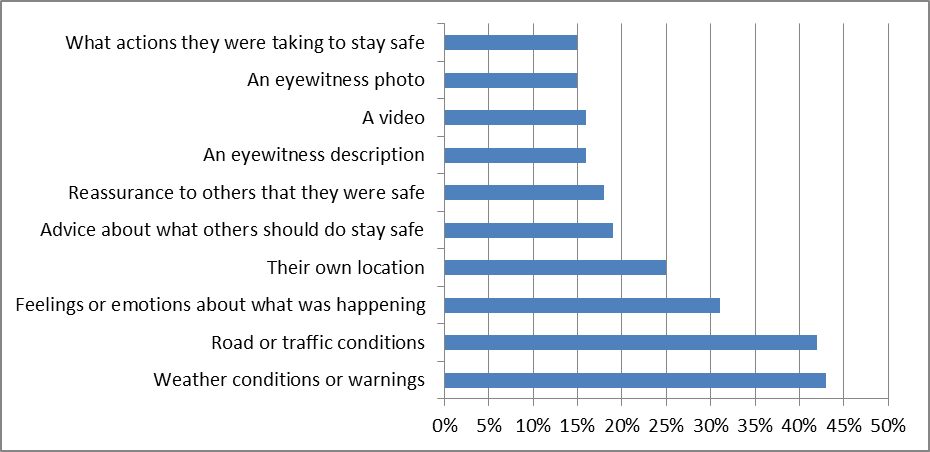
Figure 8: Types of information shared during an emergency
Table 5 on the other hand highlights any significant differences in the extent to which citizens with particular characteristics were more likely to have shared particular types of information on social media. In summary:
Gender
- Women were more likely to share weather conditions (47% versus 36% of men), and their feelings or emotions (35% had done this compared with 25% of men)
- Men were more likely to have shared their own location (33% versus 19%), advice on what to do stay safe (23% versus 15%) and what they were doing to stay safe (20% versus 11%)
Age
- Those aged 18-34 were more likely to share an eye-witness photo (20% versus 7% of those aged 55+) and a description of what they were doing to staff safe (21% versus 7% of those aged 55+)
- Those aged 55 or older were more likely to have shared weather conditions or warnings (59%) and road or traffic conditions (58%)
Social class
- Those in social classes ABC1 were more likely to share advice about what to do to stay safe (23% versus 12% of those in C2DE) and reassurances that they are safe (21% versus 13%)
- Those in social classes C2DE were more likely to share weather conditions (50%) and road or traffic conditions (54%).
Table 5: Groups of citizens most likely to share particular types of information on social media
| Gender | Class | Age | |
| Weather conditions | Women* | C2DE* | 55+** |
| Road or traffic conditions | No difference | C2DE*** | 55+** |
| Feelings or emotions | Women* | No difference | No difference |
| Own location | Men** | No difference | No difference |
| Advice on what to do to stay safe | Men* | ABC1* | No difference |
| Reassurance to others that they are safe | No difference | ABC1* | No difference |
| Eyewitness description | No difference | No difference | No difference |
| A video | No difference | No difference | No difference |
| An eyewitness photo | No difference | No difference | 18-34** |
| What they were doing to stay safe | Men* | No difference | 18-34** |
* indicates significance at p<0.05 level; ** p<0.01; *** p<0.001
Figure 9 below shows that the majority of UK citizens currently do not expect emergency services to respond to messages posted to them on social media during an emergency. Thus, only around a third (30%) of citizens agreed or strongly agreed with the statement that they would expect to get a response to such a message within an hour [Note that this is considerably lower than in the USA compared with a survey conducted there in 2012 – where around 40% agreed with such a statement].[1] The main reason for this appears to be that more than 60% of citizens think that emergency services are too busy during an emergency to monitor social media.
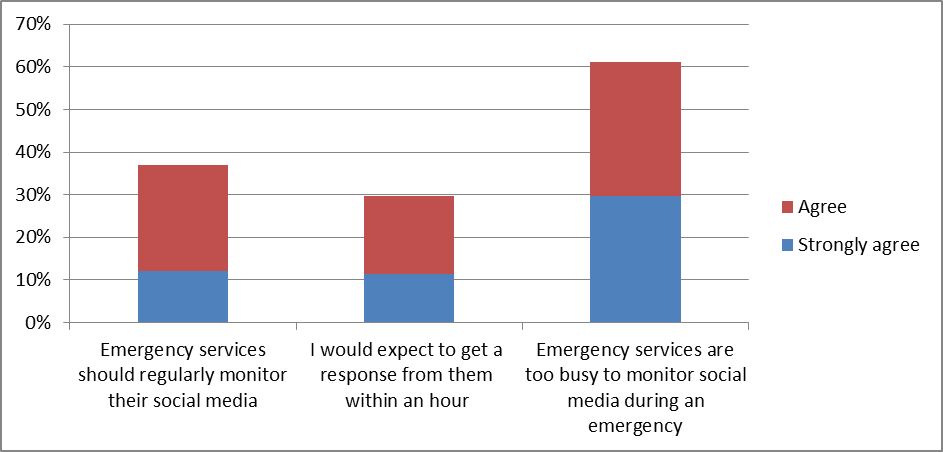
Figure 9: Expected responsiveness of emergency services to messages posted via social media
However, it is worth noting that despite this overall rather low expectation of emergency services to monitor their social media accounts and to respond to messages sent via social media, there are noticeable generational differences in attitude. These suggest that younger people – and those using mobile technology in their daily lives – generally have much higher expectations. Thus, for example, almost half of those aged 18-34 (48%) think that emergency services should regularly monitor their social media compared with only 27% of those aged 55 or older. Similarly, 41% of smartphone users agreed with this statement compared with 22% of those currently not using a smartphone.
DOWNLOADING AND USING EMERGENCY APPS
KEY FINDINGS
- Very few citizens have downloaded emergency smartphone apps relevant
- Those who had were most likely to be men, aged 25-34, in social grades ABC1, and to be regular Twitter users
- Around 40% of citizens however thought it was likely that they would use an app in future to find out information during an emergency or to receive emergency warnings
- Very few expected to use an app in future to contact emergency services rather than dialling 999.
Only a small minority of UK citizens (seven per cent) have downloaded a smartphone app that could help them in a disaster or emergency. Even when excluding those 376 participants who currently do not use a smartphone, the proportion is still only eight per cent. This is likely to represent a fairly unique group of citizens with a particular interest in emergency response or in smartphone applications. More specifically these are more likely to be:
- Men – 65% of those who had downloaded an app were male
- Aged 25-34 – 59% were in this age bracket
- Regular Twitter users – 47% of those who use Twitter on an hourly basis had downloaded such an app (in contrast 14% of those who use Twitter on a daily basis had done so)
- In social grades ABC1 – 80% fell into this social grade (16% of social grade A had done so compared with 2% of those in social grade E).
Of the 135 survey participants who had downloaded an app that could help in a disaster:
- 44% had downloaded a weather app
- 42% a first-aid app
- 36% a warning app
- 28% an emergency call app.
Ten participants indicated that they had downloaded an app that did not fall into these four broad categories. These included:
- A work specified app
- A Stolen phone tracker
- A Power cut notification
- A missing child alert
- InCase of emergency
- Health Cover
- An emergency data app
- Drum cussac
- A lack of response meant somethings wrong
- A French advice app.
Figure 10 on the other hand shows how likely participants overall thought it was that they would use smartphone apps for a variety of purposes as a result of an emergency in future. It shows that citizens are generally most likely to use apps to receive information during emergencies rather than to share information. Thus, around four in ten thought it was at least quite likely they would use an app for such a purpose. However, overall, only about 19% of the population think it is very likely they will use an app in future for at least one of these purposes.
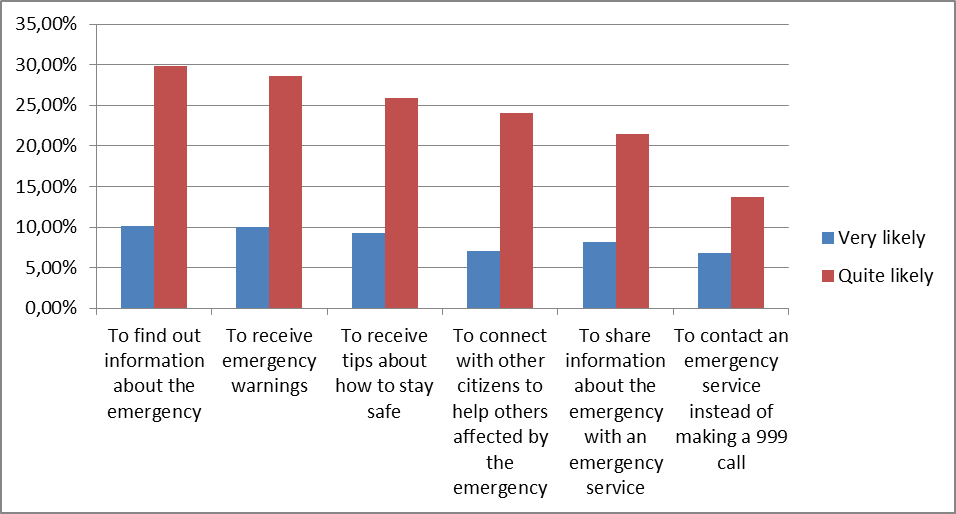
Figure 10: Likelihood of using an app in future for different purposes
Perhaps unsurprisingly, those who had downloaded an app in the past were significantly more likely to think that it was very likely they would use an app for one or more of these purposes in future.
APPENDIX
A total of 2000 UK citizens completed the survey, including 1118 women (55.9%) and 882 men (44.1%). The vast majority of respondents (91.2%) were between 25 and 74 years old. Around two third of the respondents (66.6%) were in the social grade ABC1 and around one third (33.4%) in the social grade C2DE. A large proportion of citizens (39.6%) were working full time and 25.3% was retired. Most respondents (83.1%) lived in England, especially in the South and East of England (33%). As there were significant differences between the respondents and population statistics the sample was weighted to be representative of the population. Information about gender, age, social grade, working status and region was used to weight to the sample. The analysis in the main part of this document is based on the weighted sample. The tables and figures below present further information about the demographic statistics of the unweighted sample in regards to age, social grade, working status and region.
Age
| 18-24 | 25-34 | 35-44 | 45-54 | 55-64 | 65-74 | 75+ | |||||||
| % | N | % | N | % | N | % | N | % | N | % | N | % | N |
| 3.7 | 74 | 15.5 | 310 | 18.1 | 361 | 19.5 | 390 | 19.5 | 390 | 18.6 | 372 | 5.2 | 103 |
Note. N=2000.
Social grade
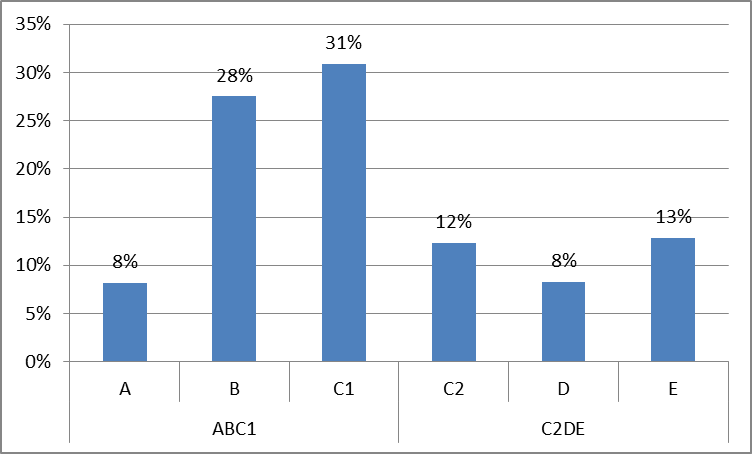
Note. N=2000.
Working status
Note. N=2000.
Region
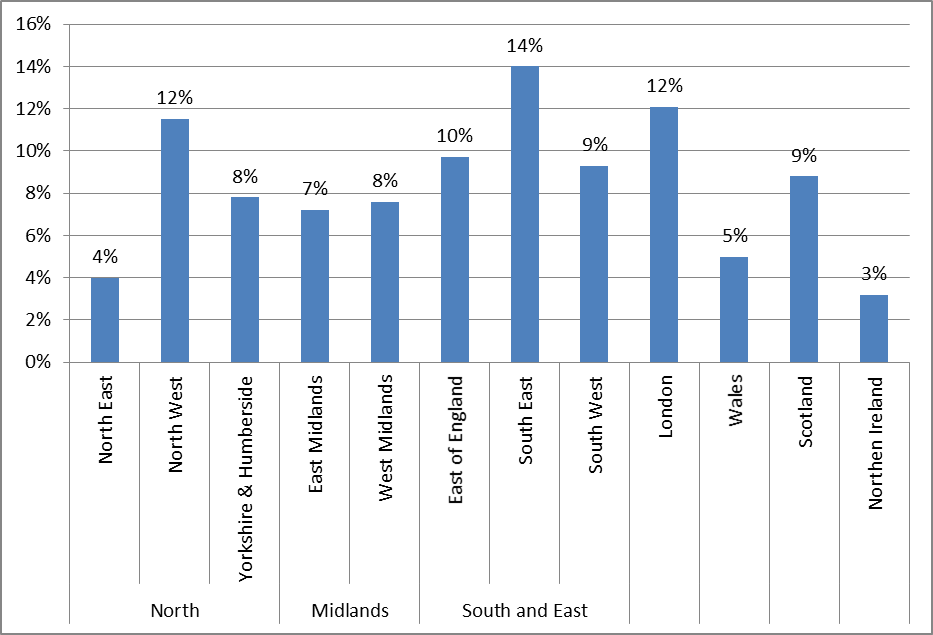
Note. N=2000.
[1] http://www.redcross.org/news/press-release/More-Americans-Using-Mobile-Apps-in-Emergencies